
News & Tips
AllAdobe IllustratorAdobe InDesignAdobe PhotoshopAutoCADCommunication & AssertivenessGuides & TipsLeadershipManagementMicrosoft 365Microsoft AccessMicrosoft ExcelMicrosoft OutlookMicrosoft Power AutomateMicrosoft Power BIMicrosoft PowerPointMicrosoft ProjectMicrosoft SharePointMicrosoft WordMinute TakingNewsPresentation SkillsProject ManagementResilienceSQLTime ManagementWordPress
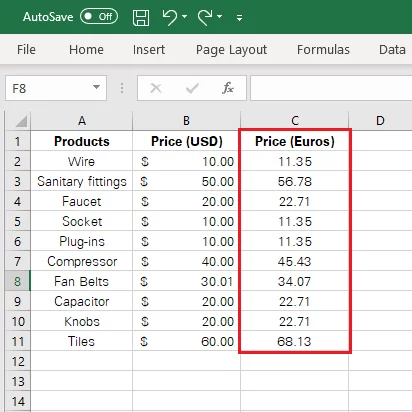
Convert Currencies With Excel – 5 Minutes Or Less!
Suppose you have financial statistics in prepared in USD, and need it converted to GBP. Why not use Excel to solve your problem? You can use currency pairs and currency exchange rates to convert currency. Excel doesn’t come packed with…
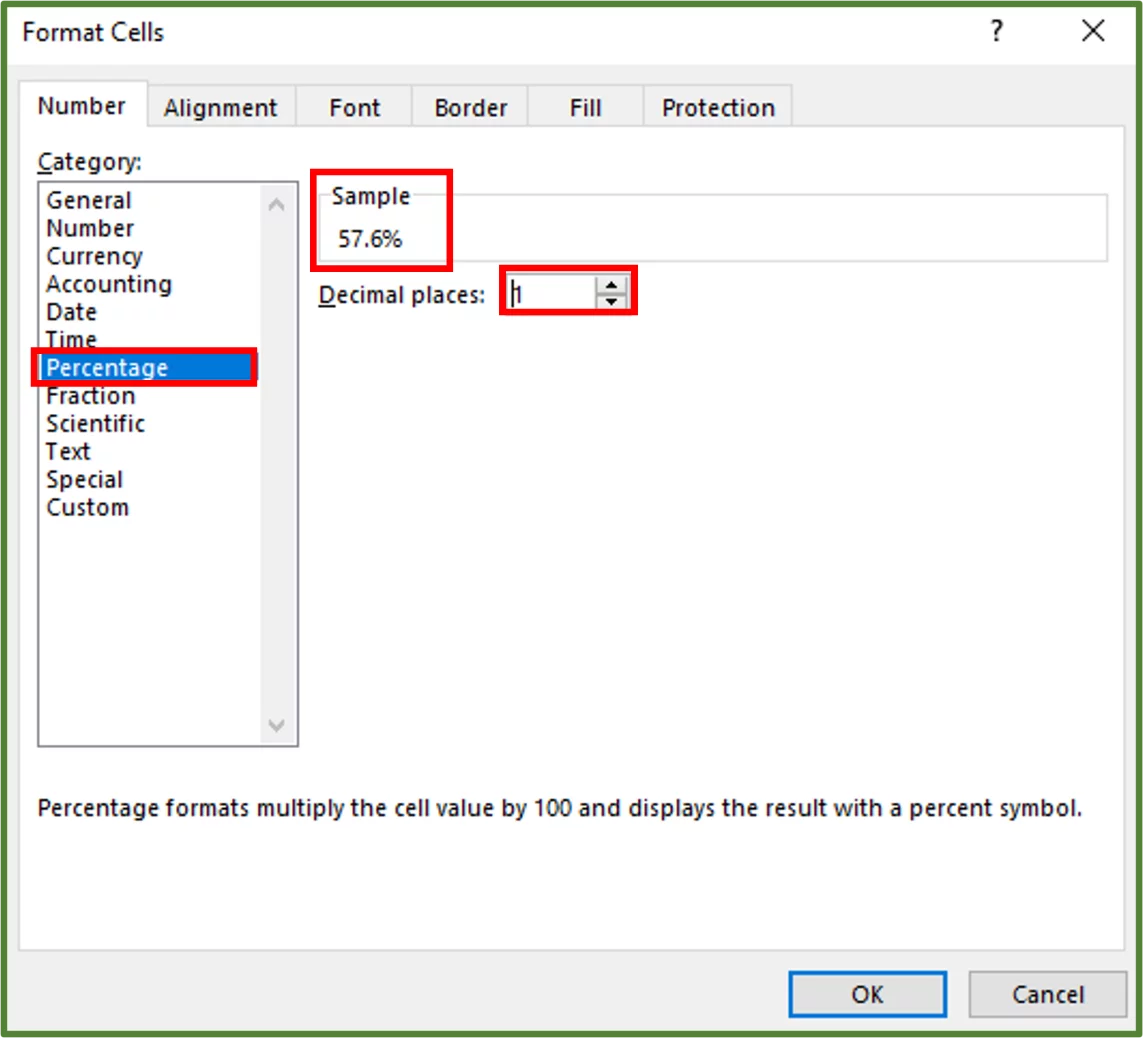
Calculate Percentage Difference in Excel [2 Practical Examples]
In this post, we will review how to calculate the Percentage Difference in Excel. Percentage Difference is the absolute value change of two values, divided by the average of them. The result is then multiplied by 100. Excel has a…
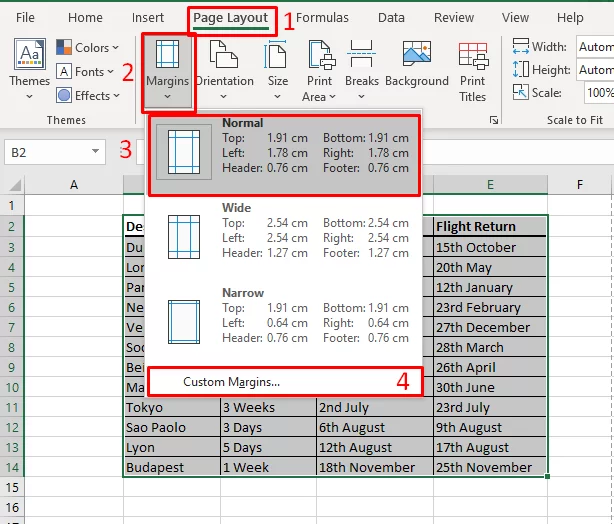
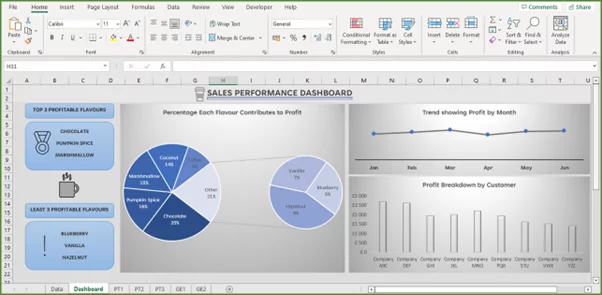
Master Your Page Layout In Excel
Page Layout is the group of commands that control how you spreadsheet looks. This guide will go over the best options to keep control of your Excel Document. This will help you make your Excel pages more readable, more eye-grabbing…
AutoCAD for Architects
Welcome to our AutoCAD course for Architects. In it we explain how to use AutoCAD to design and layout a building. Starting with the basics of setting up a file we walk you through the process step-by-step. By the end…
Microsoft Project – Beginner Training
Who hasn’t had a project delayed because of an unforeseen dependency or delay? This then ripples out to the delivery of all of the related parts of the project causing chaos, if you’re not on top of things. As the old…

Assertiveness Training Guide
Your chances of success in any undertaking can always be measured by your belief in yourself. – Robert Collier Life can be unfair. Plum assignments go to the most confident people, not the most able. People who have learned to…
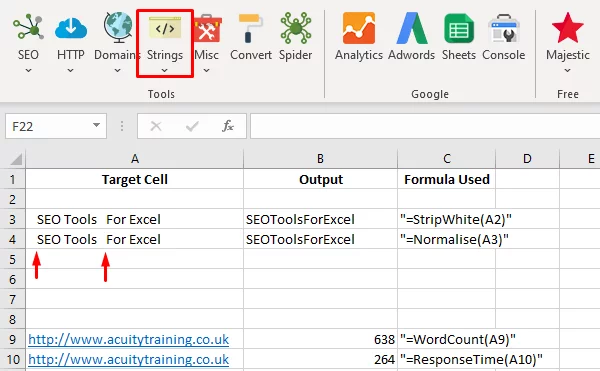
Excel For SEO – Basic Training Guide
Excel has every data analysis tool that you’ll ever need. That’s great if you know about all of them. You can focus on the fun stuff and get Excel to do the heavy lifting. We’ve provided Excel training courses to…

Create Your Own Histogram In Excel
Excel’s versatility in handling data makes it a leader among data management tools. Now imagine transforming all that statistical data into a picture for more enhanced visualisation. This is where histograms come in. Professionals from industries across the globe rely…
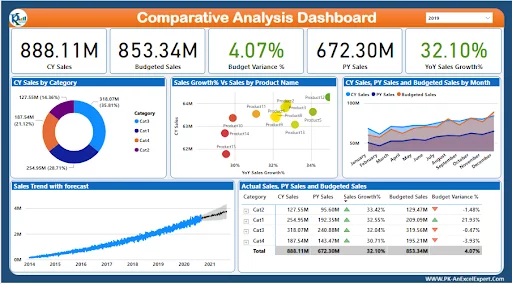
Introduction to Automated Machine Learning In Microsoft Power BI
Automated machine learning is the process of automating the tasks of applying machine learning to real-world problems. AutoML covers the complete pipeline from the raw dataset to the deployable machine learning model. Automated Machine Learning (AutoML) in Power BI for…
Pivot and Unpivot Columns in Power BI
Learn how to utilize Microsoft Power Query Editor’s pivot and unpivot features in your data queries. Pivoting describes the process of turning distinct row values into columns. Pivot rotates a column from vertical to horizontal. Pivoting data in Power BI…
Introduction to Power BI (Crash Course!)
Power BI is a visualisation and Business Intelligence (BI) tool from Microsoft, aimed at helping turn data into insights. Power BI allows you to stitch together data from across your organisation and create beautiful reports and dashboards. You can connect…

Loading Multiple Files From A Folder Into Power BI
There are countless ways to load data into Power BI. When you’re learning Power BI, this trick for loading multiple files from a folder at the same time should be near the top of your list – it can save…